Prior to and throughout the COVID-19 pandemic, civil society, governments and media outlets have issued constant warnings of a ‘African debt crisis’.
While our infographics to date have shown that these concerns are overblown for various reasons, and have been proved right so far, we thought it was worth revisiting the numbers once again, to check whether we should be adjusting our advice in any way.
Our analysis suggests that while current narratives continue to stress debt levels are reaching “unsustainable” levels, the definition of “unsustainable” is in the eye of the beholder, and therefore it is important to be cautious of accepting or using this messaging. Indeed, there is a “playbook” for presenting crises narratives which does not easily stack up, based on our analysis.
The first step in the playbook is to take a short-term view, and use absolute numbers, starting from the 2000s. This shows debt levels rising fast – implying a problem. But 2000 was around the time the “Paris Club” driven debt relief campaign – the Heavily Indebted Poor Countries (HIPC) initiative started. Showing graphs from 2000 or even 2010 distorts the picture. In any case, it’s best to look at graphs that look at debt relative to economic size (debt-to-GNI) – because that accounts for inflation and can give an indication whether an economy can “carry” the debt. If you do this, as we do, you find that most African debt-to-GNI levels are much lower than peaks in the 1990s, and overall, the African region has around 1984 levels of debt.
The second step in the playbook is to assume it doesn’t matter what loans are spent on. So, you assume a loan for vaccines or food imports will deliver the same impact on the economy as a loan for a new railway, digital infrastructure or industrial park. But this assumption is obviously patently wrong. For example, loans spent on the latter areas are more likely to produce what economists call “endogenous growth” – making people, trade and the economy overall more productive. Since 2000, many African countries have proactively sought out concessional loans from development partners – including China – to finance such projects, and this should be incorporated into the analysis of “sustainability”. Right now, it isn’t.
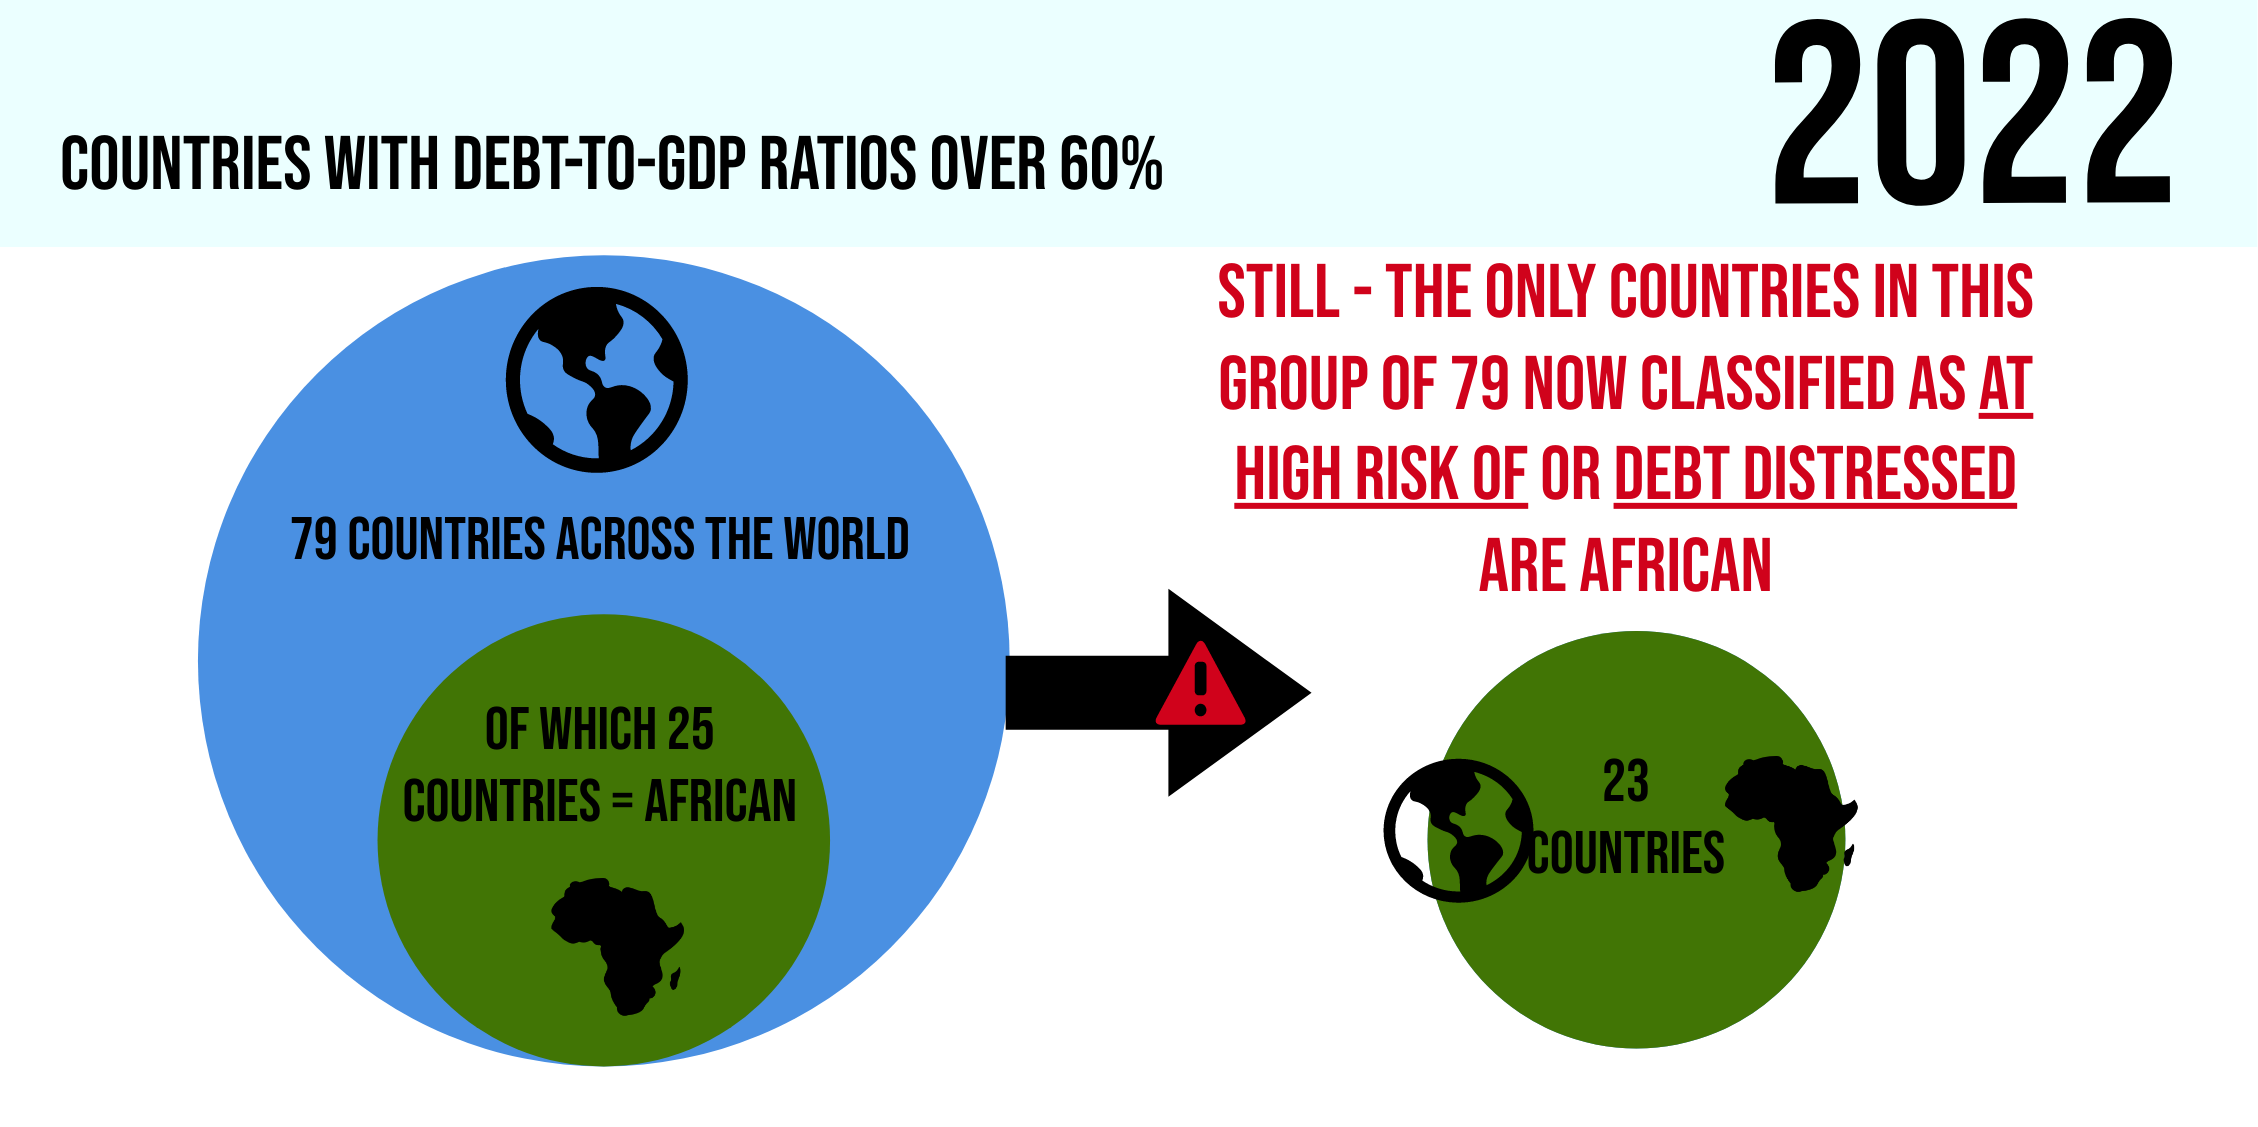
The third step in the playbook is to talk about the numbers of countries that are “debt distressed” or “high risk”. But this classification is highly problematic. Our infographic illustrates how. In 2019, 64 countries across the world had debt to GDP ratios over 60%, a third of whom – 21 countries – were African. However, all 12 of those who were classified as “at high risk of” or “debt distressed” in this group of 64 were African. This classification issue has worsened post-COVID. Now, 79 countries have debt to GDP ratios over 60%, 26 of whom are African. However, there are now 23 of the 79 that are classified as “at high risk of” or “debt distressed”, and again all 23 are African. Moreover, many high- and middle-income countries have developed with much higher than the 60% debt to GDP thresholds used for classification, and still sustain high ratios of over 100%. In other words, there is serious bias in this classification system, and their use should be avoided until this bias is corrected. No wonder a 2015 study found that African countries pay 2.9 per cent higher on bonds than the rest of the world!
The fourth and final step in the playbook is to present large figures on loans from China. While these are mostly factually correct, often, loans from other lenders are not mentioned. More recently, some analysts have started to present the scale of loans from the private sector lenders. However, few show how bilateral lending has changed, which also gives more context for Chinese lending. Our infographic for the first time illustrates the comparable shifts, and it is revealing. The fact is many other bilateral lenders used to lend to African countries to similar degrees as China. They just have decided not to in recent decades. Is that responsible? We would argue it is not. African countries still need as much infrastructure today as they did – if not more – in the 1970s, given rising populations and opportunities for trade with the rest of the world.
So why does this 4-point playbook matter? And what do we advise when it comes to debt relief then? To date, since the COVID19 outbreak, 3 out of 55 African countries have defaulted on debt payments, and concerns have been raised about whether others such as Ghana, Kenya and Nigeria might do the same. Surely this is not “disinformation” or “fake news”?
Absolutely not. But based on our in-depth analysis, we would suggest that these countries have to date faced a debt liquidity crisis, not a debt solvency crisis, and they all continue to face a long-term crisis of insufficient debt for development.
Put more simply, these countries have taken at least a proportion of their loans that are too expensive, but nevertheless in “normal times” would have the potential to pay the debts. However, because their revenues were dampened due to COVID19 and its global effects, they have not been able to pay back the loans on time. Even in the case of Zambia, which has now sought and approved a bailout programme from the IMF, the world’s lender of last resort, our analysis is that the country was not necessarily insolvent, it was facing liquidity challenges. Indeed, our advice to a country in this situation would be to seek agreements from as many creditors as possible to put off payment demands for 2-3 years because of COVID19 (comprehensive “debt suspension”) and seek restructuring of as many loans as possible to accommodate these suspensions as well as to lower overall interest payments, while ensuring that as many of the existing loans are channelled as swiftly as possible into productive activity.
Why? The long-term insufficient debt problem. African countries such as Zambia, Ethiopia, Chad – still need to develop and alleviate poverty. But their economies are too small – at least on their own – to raise enough finance to do this. This is why, as our infographic shows, African debt as a whole is a tiny fraction of global debt, or even debt owed by single G20 economies. The world can easily manage any debt suspensions, restructuring and even defaults. On the other hand, more spending in African countries can be very productive domestically and globally – it can create jobs, it can create new markets, it can allow economies to expand and trade more with each-other and the rest of the world. Cancelling a proportion of debt, bailout programmes that come with policy conditions (such as that Zambia has accepted), or even swapping existing debt for specific environmental projects, will not necessarily enable this kind of productivity because of the concequences cancellation will have on future African interest rates – driving up premiums and making repayment of future debt more expensive.
For African citizens, the most worrying crisis must be the long-term insufficient debt problem. Until there are answers to that, of course offers of debt relief and restructuring are welcome, especially those without policy conditions. But African governments should simultaneously be wary of the debt crisis playbook and keep eyes on the prize – finding ways to address the insufficient debt problem.
Our infographics below explain all.
 To find out how Development Reimagined can support you, your organisation or Government to review key economic response policies to the COVID19 crisis, the Russia/Ukraine war and other shocks please email the team at clients@developmentreimagined.com.
Special thanks go to Rugare Mukanganga, Jade Scarfe, Yalelet Yihun, Jing Cai and Ivory Kairo for their work on the graphics, collecting/analysing the underlying data and sharing this accompanying article.
The data was collated from a range of sources including: government websites and media reports, IMF and World Bank data and statista. Our methodology is entirely in-house, based on analysis of economic growth, inflation and other trends.
If you spot any gaps, have any feedback or would like to follow-up on this infographic to request some further information or underlying data, please write to us at interns@developmentreimagined.com, we will aim to respond ASAP!
September 2022
