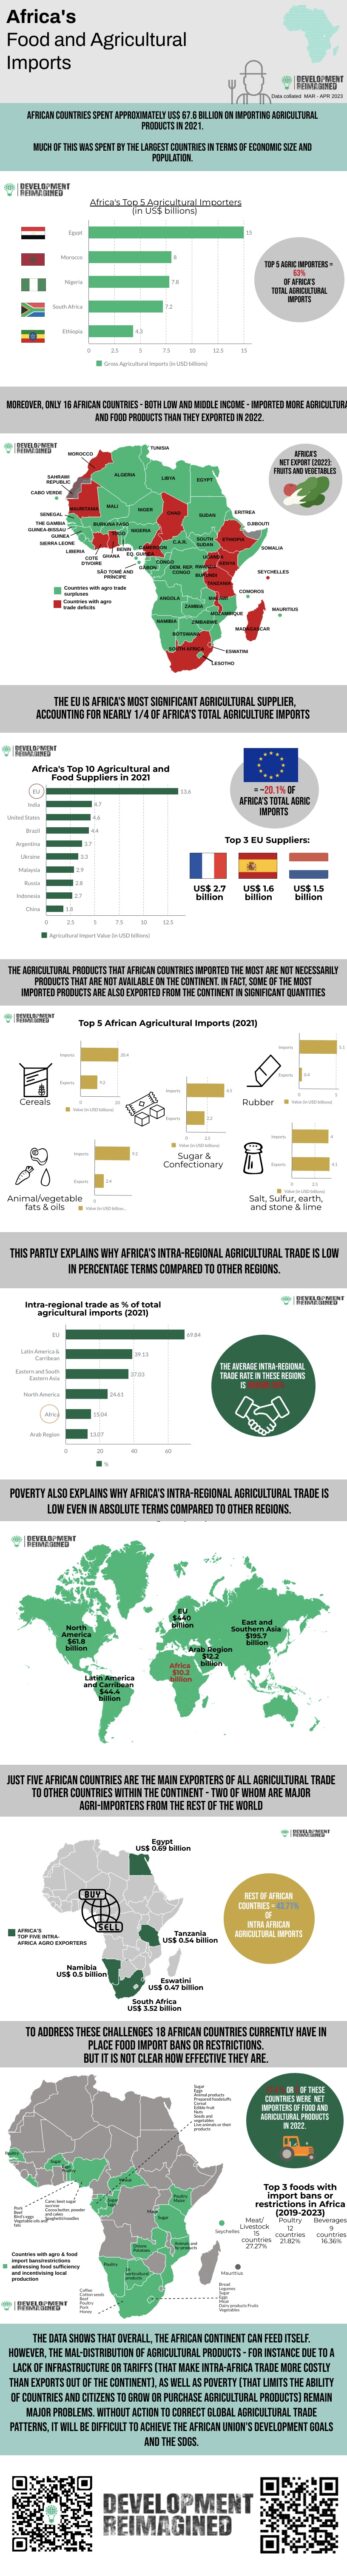
At a recent conference the African Continental Free Trade Area Secretariat’s Secretary General Wamkele Mene remarked “I see milk from New Zealand in an African country when we have milk in Uganda”. His comment highlighted the need for African countries to both produce and trade raw and processed agricultural products between themselves, instead of importing them from other countries.
His concern was a valid one. As our infographic this month reveals, in 2021, African countries spent almost $68 billion on importing agricultural products – money that could have been spent on other needs. Importantly, it wasn’t just the countries with the largest populations that imported the most, such as Nigeria and Ethiopia. It was also the largest, most developed economies on the continent – such as Egypt, Morocco and South Africa. Indeed, most African countries export more agricultural products than they import – partly due to a lack of income to be able to import more food. In 2022, only 16 African countries – including some of these largest countries – were net importers of food products.
So where did these products come from? While, as Wamkele Mene suggested, New Zealand was one of the sources, by far the largest source of agricultural products was the EU, followed by India, the US and Brazil. The inclusion of the EU and US might seem like a surprise – as these are high-income countries that in general trade theory should hardly produce or export agricultural products, given high costs of labour. However, Europe, the US, and many other high-income countries spend billions to subsidise their agricultural sectors, which distorts (lowers) the price of their export products. Within the EU, Ukraine was a large supplier – but, alongside Russia, was broadly comparable to Argentina and Malaysia as an import source for the continent (NB: This data is important to bear in mind when considering impacts of the Russia/Ukraine war on food availability and prices on the African continent).
And what exactly did African countries import from these close and far-flung sources? The top five products were cereals, fats and oils, rubber, sugar and confectionary, and salt, sulfur, earth, and stone & lime (i.e. raw quarry products). However, in some cases – such as cereals, sugar and raw quarry products, these are simultaneously products that Africa exports in significant quantities. This data backs up Mene’s remark – there is clear potential for intra-Africa trade in many agricultural products.
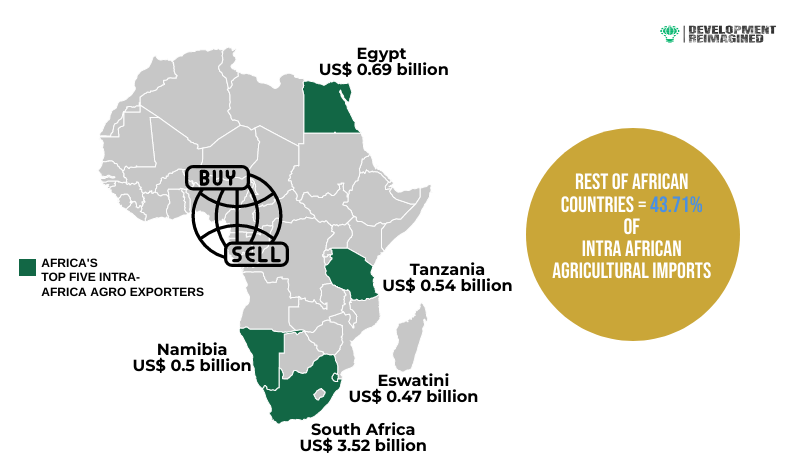
Yet, as our graphic also shows, intra-Africa agricultural trade is currently low in absolute and relative terms to other regions, representing only 15% of Africa’s total agricultural imports in 2021. Additionally, intra-Africa agriculture is concentrated in five countries, with South Africa alone accounting for a third of all intra-Africa agro trade, who may well be importing externally to then (re)export to the rest of the continent.
This begs the question why, and whether, for instance, food import bans might help. To date, 18 African countries have enacted food import bans and restrictions on meat, poultry, and beverages between 2019 and 2023. These may have been effective – because out of these 18 countries, only five were net importers of food in 2022.
On the other hand, the subsidies referred to elsewhere, as well as (as we have argued elsewhere) a lack of infrastructure across the continent, is likely a strong impediment to intra-Africa trade, exacerbating import dependency. A recent paper by the Asian Infrastructure Investment Bank (AIIB) found global evidence that countries with poorer infrastructure see larger bilateral trade deficits versus those with better infrastructure, even if they reduce tariffs and liberalize.
Overall, our analysis suggests that Africa has the potential to feed itself, or at least feed itself more! But poverty, a lack of infrastructure, as well as agricultural subsidies in other regions, remain significant problems that lead to higher imports and a mal-distribution of agricultural products. Without action to correct global agricultural trade patterns, achieving the African Union’s Development goal and the SDGs will be challenging.
To find out how Development Reimagined can support you, your organisation or Government please email the team at clients@developmentreimagined.com .
Special thanks go to Sena Voncujovi, Rugare Mukanganga, Patrick Anam, Yixin Yu and Osaru Omosigho for their work on the graphics and collecting/analysing the underlying data and this accompanying article.
The data was collated primarily from UN COMTRADE, as well as other sources, including government websites, media reports, and the International Trade Administration (ITA) database. Our methodology is entirely in-house, based on analysis of recent agricultural trade trends (both externally and regionally), import bans and restrictions, and other trends.
If you spot any gaps or have any enquiries, please send your feedback to us at team@developmentreimagined.com, and we will aim to respond asap.
May 2023
